First-ever look at child, youth homelessness data at county, congressional district levels reveals impact of pandemic

Contact: Alisha Qiu, (734) 934-2481, schoolhouseconnection@wearerally.com
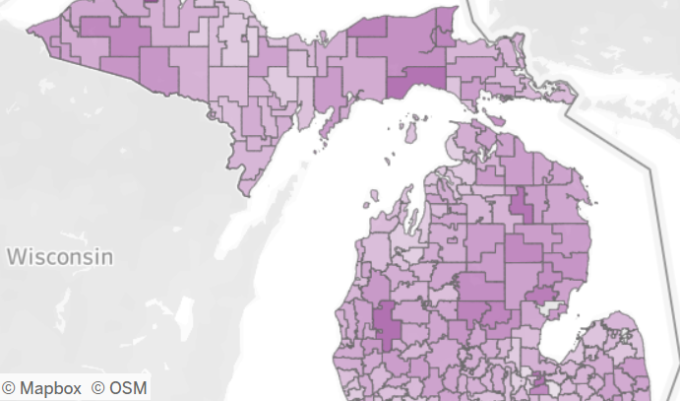
WASHINGTON, D.C. – National nonprofit SchoolHouse Connection and Poverty Solutions at the University of Michigan today released searchable data profiles that make available—for the first time—data on child and youth homelessness at the county and congressional district levels, as well as the national, state, and school district levels.
The profiles raise awareness of the scale and impact of homelessness on children and youth and underscore the need for action to meet their needs.
“As a new session of Congress begins, and many state legislative sessions commence, these data profiles will help shine a light on a hidden population of vulnerable children and youth,” said Barbara Duffield, executive director of SchoolHouse Connection. “We hope policymakers and practitioners alike use the profiles to understand gaps in support and to take action to prevent today’s homeless children and youth from becoming tomorrow’s homeless adults.”
The county, congressional district, and school district profiles include the following data:
- The numbers of PreK-12 children and youth identified as experiencing homelessness and enrolled in school in the 2020-2021 school year, including the number of students experiencing homelessness as a percentage of all students and the percent of school-aged children living in poverty.
- The living situation of children and youth when they were first identified as homeless.
- Status as English learner, special education student, migrant, and/or unaccompanied youth (youth not in the physical custody of a parent or guardian).
- Race/ethnicity of identified children and youth experiencing homelessness.
- The number/percent of school districts that received dedicated federal funding to support children and youth experiencing homelessness (county/congressional district); or federal funding subgrant status (school district).
The state and national profiles include these additional data elements:
- Estimates of children under age 6 experiencing homelessness.
- Number/percent of young children experiencing homelessness enrolled in Head Start or Early Head Start.
- High school graduation rates.
- The number of unaccompanied youth experiencing homelessness who completed the Free Application for Federal Student Aid (FAFSA) over the past three years.
- The number of school districts that received one-time COVID-19 relief funds (known as the American Rescue Plan – Homeless Children and Youth funds), including as a percentage of all school districts.

Jennifer Erb-Downward
“One of the important elements of the data profiles is that they allow communities to explore where under-identification of children experiencing homelessness may be taking place. We know that under-identification is widespread and that it negatively impacts children, depriving them of critical support. With these data, communities can change this long-standing issue,” said Jennifer Erb-Downward, director of housing stability programs and policy initiatives at U-M’s Poverty Solutions.
The data profiles are accompanied by two new analyses:
- An analysis of patterns of under-identification among school districts that do and do not receive dedicated funding to serve children and youth experiencing homelessness, including rural school districts and public charter schools. The analysis reveals that the likelihood of under-identification is much higher in school districts without dedicated funding, and that the number of school districts receiving dedicated homeless education funding more than doubled as a result of a bipartisan amendment to the American Rescue Plan Act, now reaching over half of all school districts.
- An analysis of recent trends in child and youth homelessness that show the impact of the pandemic, including a disproportionate decline in enrollment and increase in chronic absenteeism.
The child and youth homelessness data profiles will be updated in Fall 2023 to incorporate 2021-2022 data, include more early childhood data, and show trends over time.
