New Michigan poverty map identifies needs related to education, food insecurity, affordable housing

Contact:
Karissa Knapp, ktknapp@umich.edu
Jared Wadley, jwadley@umich.edu
ANN ARBOR—A new data map showcasing diverse indicators of poverty and well-being throughout Michigan highlights the key challenges confronting residents in different parts of the state and suggests interventions for the state’s most critical needs.
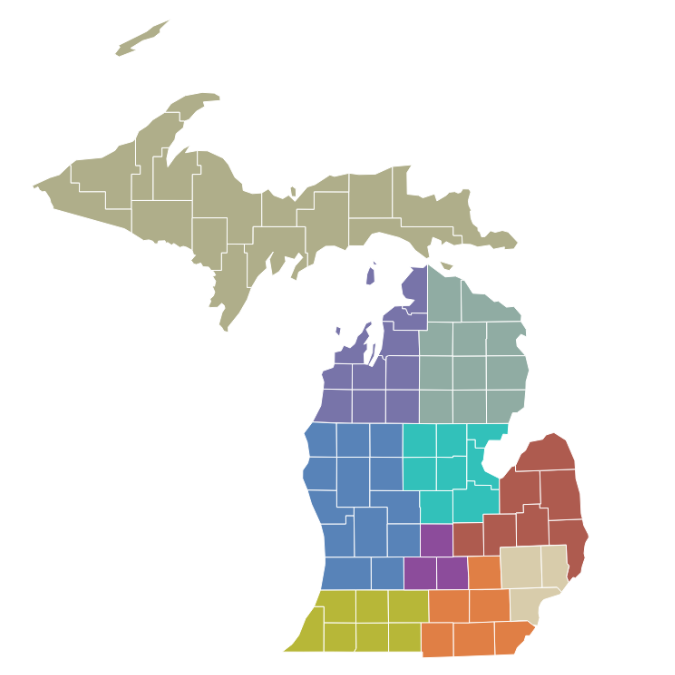
Poverty Solutions at the University of Michigan has released an updated version of its Michigan Poverty & Well-being Map with statewide, regional and county data. The new iteration of the map, which Poverty Solutions has maintained since 2017, features 2021 data from the Census Bureau’s American Community Survey.

Luke Shaefer, Director of Poverty Solutions at U-M
The revised map separates the data by Michigan’s 10 Prosperity Regions, which allows viewers to look at the unique dynamics at play in different areas of the state.
“The poverty rate alone doesn’t give us a complete story of how many people are facing economic instability and hardship. The Michigan Poverty & Well-being Map looks at multiple metrics to give us a more holistic idea of how Michiganders are doing,” said Poverty Solutions faculty director Luke Shaefer, professor of social work and public policy.
Some key metrics from the data include:
- 13% of Michiganders were living on income below the federal poverty line, which is about the same as the previous year. The national poverty rate is 11.5%.
- 17.6% of children under age 18 were in households below the federal poverty line.
- 31.3% of residents paid 30% or more of their income on housing costs, which is above the threshold of what’s considered affordable.

Amanda Nothaft, Director of Data and Evaluation at Poverty Solutions
“The disparities highlighted by the map can inform how state and local officials address these issues and where to invest resources to support their residents, their region and the state,” said Amanda Nothaft, director of data and evaluation at Poverty Solutions, who led the data analyses for the map project.
Investing in education, for example, by expanding preschool programs and providing additional training beyond high school, is one recommendation Nothaft makes. This kind of funding for education could improve employment prospects and economic well-being in the state, she says. Other areas of need illustrated by the data include food insecurity, affordable housing, child poverty, child care, unemployment and income.
Learn more about each region’s challenges by viewing the regional fact sheets:
- Detroit Metro: High Housing Costs Burden Residents
- East Michigan: Investment in Education Can Boost Wages
- East Central Michigan Sees High Rates of Food Insecurity, Despite High Rates of Food Assistance
- Northeast Michigan Faces Highest Child Poverty Rates in the State
- Northwest Michigan: Tight Housing Market Puts Cost Burden on Renters
- South Central Michigan: Investing in Education in Lansing Can Boost Economic Well-being
- Southeast Michigan: Racial Disparities Underlie Strong Economic Position of Residents
- Southwest Michigan: Many Residents Are Above the Poverty Line But Still Struggling
- Upper Peninsula Residents Face Cost of Living Challenges
- West Michigan Should Invest in Addressing Poverty in Lake County
How do we measure poverty?
Nothaft explains measurements used at Poverty Solutions and in the Michigan Poverty & Well-being Map.
