
Poverty Solutions helps develop new #BankBlack interactive map
By Lauren Slagter
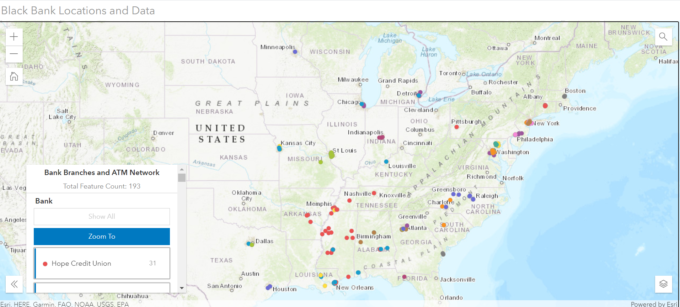
ANN ARBOR — A new interactive map from BankBlackUSA is making it easier for people to identify Black-owned banks and credit unions across the country in an effort to leverage Black economic power and overcome the racial wealth gap.
Christian Hunter, a second-year master’s student studying urban and regional planning at the University of Michigan, helped develop the map through his role as a research assistant with Poverty Solutions at U-M, a university-wide presidential initiative that aims to prevent and alleviate poverty through action-based research.
BankBlackUSA is a grassroots organization born from the larger #BankBlack movement in response to police killings of Black men in 2016. Terri Friedline, an associate professor of social work at U-M who studies access to the financial system, has worked with BankBlackUSA through her research, and she connected the group with Poverty Solutions for technical assistance on the mapping project.
“Growing out of (Friedline’s) work on finance institutions and digital redlining, it seemed like increasing the availability of good information on minority-owned banks could lead to better financial services for people in the areas those institutions serve,” said Trevor Bechtel, student engagement coordinator at Poverty Solutions who helped facilitate the partnership.
Related: Forbes article: How BankBlackUSA is helping empower Black-owned banks and credit unions

Christian Hunter
Hunter spent the summer of 2020 developing the map, which shows branch and ATM locations of Black-owned banks and credit unions. The map also displays each bank and credit union’s contact information, interest rates on financial products, and the institution’s financial health grade, a measure of stability developed in response to the 2008 financial crisis.
“I learned a lot about Black banks and how they’ve changed over time and the distribution (across the country),” Hunter said. “It’s a really important part of a larger story to tell about how they’re a viable option that historically may not have been advertised as much. I hope this project and the map will help with that and show how accessible they are.”
Hunter said there are plans to continue adding demographic data to the interactive map, which researchers could use as a starting point for analysis of topics like the role of Black-owned financial institutions in certain communities and which populations live in banking deserts.
In May 2021, BankBlack launched a new data dashboard developed by students at U-M’s School of Information. The dashboard provides information on the small business loans and home mortgages provided by Minority Depository Institutions and Community Development Financial Institutions, which support underrepresented communities and are often underutilized due to a lack of awareness of their services.
We are so excited to share that our @BankBlackUSA Dashboard is now available to see. It’s been a pleasure to partner with @UMich @umsi #PovertySolutions to create this resource! #BankBlack https://t.co/DiLlkosPSW
— Stephone 💎♦️ (@MoStephone) May 22, 2021
This post was updated in May 2021 with information on the new BankBlack data dashboard.
Learn more
Consumers’ race, income affect quality of financial services, treatment by lenders
Amiyatosh Purnanandam, professor of finance at U-M and Poverty Solutions faculty affiliate
Exclusion and Marginalization in Financial Services: Frontline Employees as Street-Level Bureaucrats | Infographic
Terri Friedline, associate professor of social work at U-M and Poverty Solutions faculty affiliate
Intergenerational wealth mobility and racial inequality | data visualization of wealth mobility rates by race
Fabian Pfeffer, associate professor of sociology at U-M and Poverty Solutions faculty affiliate