11.5%
People lived in poverty

Poverty Solutions at the University of Michigan
Joan and Sanford Weill HallThough poverty may seem a straightforward concept, how we define and measure it is a matter of great debate. And this debate is important, because how we measure poverty is central to how we define, understand, and improve well-being in our society.
Learn more about current poverty metrics and how we measure poverty in the U.S. below.
Watch Amanda Nothaft, Poverty Solutions director of data & evaluation, speak about measures of poverty and how we use this data in our work.

SOURCES: U.S. Bureau of the Census 2022 Poverty and Income in the United States reports
Though poverty may seem a straightforward concept, how we define and measure it is a matter of great debate. And this debate is important, because how we measure poverty is central to how we define, understand, and improve well-being in our society. We are constantly confronted with articles and analyses describing the growth or decline in the poverty rate, a certain program’s impact on poverty, and how we can best eliminate poverty. But what does it all mean? How do we actually define what it is to be poor in the United States? And why do we do it at all?
We largely use poverty measures for two central reasons: to target resources to those in need, and to measure our progress in improving well-being in society.
The most common way we measure poverty in the United States is through the Official Poverty Measure (OPM), a measure of income poverty developed in the 1960s. The OPM sets a certain income threshold, which varies by family size and is pegged to the rate of inflation; households with incomes below that threshold are considered poor. In 2024, the OPM threshold for a family of four is $31,s00, and it’s estimated that in 2022, 11.5% of Americans were living beneath that OPM threshold. The OPM is the most commonly referenced poverty measure and is used in determining the eligibility criteria for a whole range of government programs.
Read our brief on what the U.S. spends on anti-poverty programs
Though the OPM is the most commonly used poverty measure in the United States, scholars and policymakers have long pointed to the weaknesses of the OPM as an accurate measure of well-being. The OPM thresholds we use today were largely developed by Mollie Orshansky, an economist working in the Social Security Administration in the early 1960s. President Lyndon B. Johnson’s administration operationalized the OPM in efforts to measure progress in its War on Poverty. Leaning on survey data that showed American households in the mid 1950s spent roughly one-third of their budget on food, the adopted threshold was set at three times a subsistence food budget as defined by the Department of Agriculture and adjusted for family size. Other than adjustments for inflation, this threshold is basically the same one we use today.
While there may be some utility in using a consistent measure over such a long period of time, the world has also changed considerably since the mid 20th century. For example, housing eats up far more of household budgets than it did in the 1960s, and food accounts for much less, meaning the current threshold fails to properly account for an adequate basic-needs budget in today’s world. In addition, the OPM is not adjusted for regional variation in cost-of- living, a significant flaw when the cost of housing varies considerably by geography. The OPM also fails to properly account for other essential household expenses, such as transportation and child care. Finally, the measure does not account for many in-kind benefits and tax credits meant to improve overall well-being in low-income households, meaning the Official Poverty Measure is unresponsive to many policies meant to combat poverty.
In 2011, the Census Bureau began publishing the Supplemental Poverty Measure (SPM) to address the shortfalls of the official measure. Rather than basing the threshold off historical food budgets, the SPM threshold uses expenditure data on food, clothing, shelter, and utilities. The SPM also accounts for regional variation in housing costs, and – perhaps most importantly – includes in-kind benefits and tax credits in overall household resources. This is important because while the OPM shows a relatively stable poverty rate over time, historical analyses using the SPM show that poverty has dropped considerably since the late 1960s, largely as a result of government programs.
While the SPM was developed in response to critiques of the OPM, many scholars believe any attempt to define a poverty threshold based on a “basic necessities” basket of goods is an inherently flawed approach in a wealthy democracy. Rather, these scholars believe that a relative poverty measure is more appropriate, defining the poverty threshold at 50% of a country’s median income, for example. A relative measure of poverty moves away from measuring the share of individuals facing absolute deprivation and seeks to measure the share of individuals who are unable to fully participate in society. Rather than trying to adjust and readjust an absolute threshold as costs, demands, and lifestyles of a particular society change, a relative threshold constantly adjusts to these changes, measuring who is being left behind. Many scholars believe that while an absolute threshold may be beneficial in a developing economy, a relative measure is far more useful in a wealthy democracy, allowing for better policy responses and more accurate cross-national comparisons of poverty. If we place the poverty threshold at 50% of a country’s median, the poverty rate in the U.S. rises to roughly 18%, far above the rate seen in other developed nations.
Still other scholars suggest that the use of any threshold – absolute or relative – may fail to accurately assess the state of well-being in the United States. The OPM, SPM, or even a relative threshold are all indirect measures of economic well-being, estimating the amount of resources a household requires to meet their needs. An alternative way to measure well-being, however, is by simply asking households directly about their ability to meet basic needs: do they have enough to eat, can they pay their bills, are they able to see a doctor when they need to? There are a number of surveys that seek to understand the state of material hardship in U.S. households – most notably the Survey of Income and Program Participation (SIPP) – and when these data are combined with the OPM and SPM, they offer a more holistic view of the state of well-being in America. For example, research finds that hardship often exists in households with incomes well above the poverty line, while some households in poverty – perhaps due to the aid of government programs – don’t demonstrate hardship. Relying on measures of material hardship, former Poverty Solutions postdoctoral scholar Richard Rodems found that roughly 45% of U.S. households move into and out of either material hardship or income poverty over a two-year period, presenting a picture of widespread economic precarity in the U.S.
Compared to other wealthy nations, poverty rates in the United States are quite high. Many European countries, and the Organization for Economic Cooperation and Development (OECD), use a relative poverty measure, typically setting the poverty threshold at 50% of the country’s median income. These measures, therefore, are more of a gauge on inequality than deprivation, setting an income threshold that allows citizens to fully participate in society, rather than live at some minimal level of subsistence.
Using this relative measure, the poverty rate in the United States is roughly 18%, the second highest among 38 countries measured by the OECD and ahead of only Costa Rica.
By comparison several countries in northern, western, and eastern Europe have relative poverty rates below 10%. More international comparisons can be found at the LIS Cross-National Data Center, Eurostat, and the OECD.
In recent years, much attention has been paid to the United Way’s report on Asset Limited, Income Constrained, Employed (ALICE) households. The ALICE report sets a minimum basic needs threshold far above the poverty threshold, based on estimated household expenses for different family sizes. For example, the ALICE threshold for a family of four (two adults and two young children) is roughly $61,000, including expenses like child care, housing, transportation, and health care. ALICE is designed to capture those households whose incomes put them above the income poverty threshold, but who are still struggling to afford basic household necessities. The ALICE rate combines these households with those under the poverty line.
Since the United States first began recording poverty data in 1959, poverty rates have been far higher for Black and Hispanic Americans than for White Americans. In 1959, the poverty rate for Black Americans was a shocking 55.1%. In the 1960s, when poverty dropped steeply, much of this reduction was due to the fall in the Black poverty rate, though by 1969 roughly one-third of Black Americans remained poor. Beginning in the early 1970s, the Census Bureau began recording poverty rates for Hispanic Americans as a separate ethnic group, enabling comparisons between the poverty rates for Black Americans, Hispanic Americans, and non-Hispanic whites. The disparities were vast. In 1976, the poverty rate was 31% for Black Americans, 25% for Hispanic Americans, and 8% for non-Hispanic Whites.
Since then, Black and Hispanic poverty as measured by the OPM has declined significantly but is still far above the poverty rate for White Americans. The poverty rate for Black and Hispanic Americans took a significant dip in the booming economy of the late ‘90s, falling from roughly 30% for both groups in 1995 to roughly 22% in 2000. In 2018, 21% of Black Americans and 18% of Hispanic Americans were living in poverty, while the poverty rate for non-Hispanic Whites was the same as it was in 1976: 8%.
While the poverty rate for non-Hispanic Whites has been relatively stable (it only rose above 10% in three years since 1976, and never rose above 11%), the poverty rate for Black and Hispanic Americans is highly contingent on the state of the economy, in part due to their overrepresentation in low-wage industries that suffer losses during recessions and only see wage growth when the economy is strong. As noted above, this is why the poverty rate for Black and Hispanic Americans fell substantially in the economic expansion of the late 1990s and shot back up during, and in the years following, the Great Recession.
These disparities persist when we look at rates of material hardship. In an analysis of hardship measures from the Survey of Income and Program Participation (SIPP) from the mid 1990s to 2011, former Poverty Solutions Postdoctoral Scholar Richard Rodems found that nearly 40% of Black households and 36% of Hispanic households experience some form of material hardship, versus just 20% of White households. The share of households experiencing “hidden” hardship – households that are not income poor but still experience a form of material hardship – are also higher amongst Black and Hispanic households (25% and 24%, respectively) than amongst White households (16%).
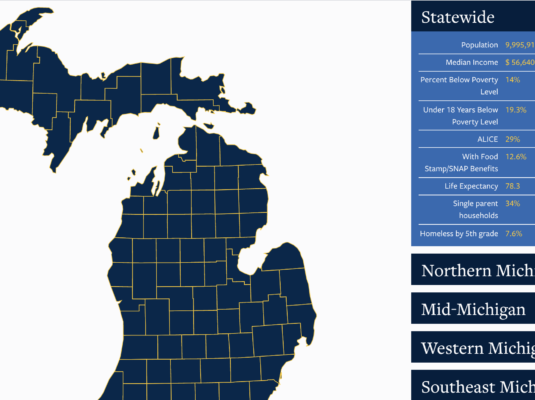
This map streamlines poverty and well-being data to understand what’s happening in counties across Michigan.

This index represents a holistic look at disadvantage, using health indicators (life expectancy, low infant birth weight), poverty metrics (rates of poverty and deep poverty), and social mobility data (Opportunity Insights Mobility Metrics).
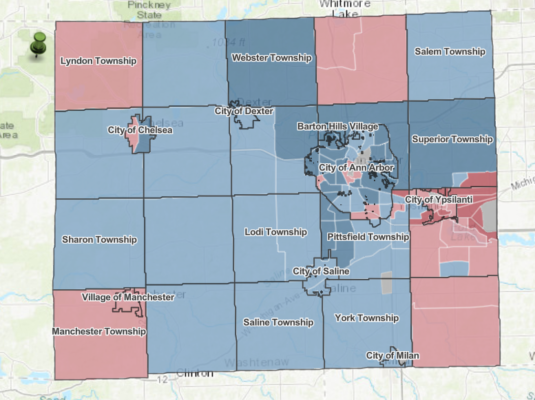
The Opportunity Index measures access to opportunity in each Washtenaw County census tract by combining 16 indicators into five categories: health, job access, economic well-being, education and training, and community engagement and stability.


