» Data Tools Skip to main content
U-M Poverty Solutions Logo U-M Poverty Solutions Logo

Our Work

Data Tools

Poverty Solutions produces data and tools for the public to explore issues related to poverty. These tools allow people from different fields to tailor and engage with data from the University of Michigan and our partners in a way that is meaningful to them and the unique needs of their organization.

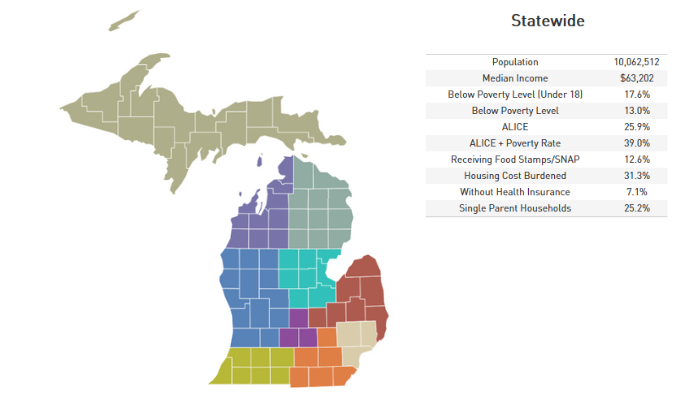
Poverty and Well-Being Map

View the Map
Map of MI by region, with state-wide poverty metrics
Map of the U.S. showing the most disadvantage communities by color coding counties

The Injustice of Place: Index of Deep Disadvantage

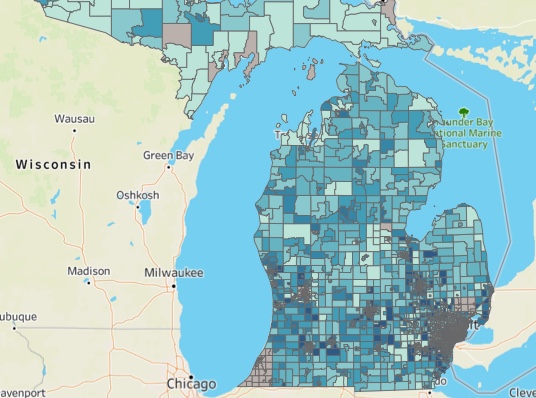
This index represents a holistic look at disadvantage for counties and cities, using health indicators (life expectancy, low infant birth weight), poverty metrics (rates of poverty and deep poverty), and social mobility data (Opportunity Insights Mobility Metrics).

Read more

The Transportation Security Index

University of Michigan researchers have developed the first validated measure of transportation security that offers insights into who experiences transportation insecurity and enables researchers and practitioners to determine which interventions can improve this condition.

Read more

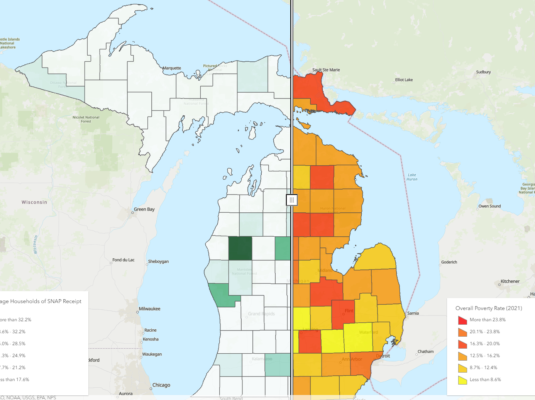
Food Security in Michigan

Poverty Solutions partnered with the Michigan Department of Health and Human Services and the Food Bank Council of Michigan to create a food security map that shows data related to employment, poverty, and food assistance.

Read more
Michigan opioid crisis map

Michigan Opioid Crisis

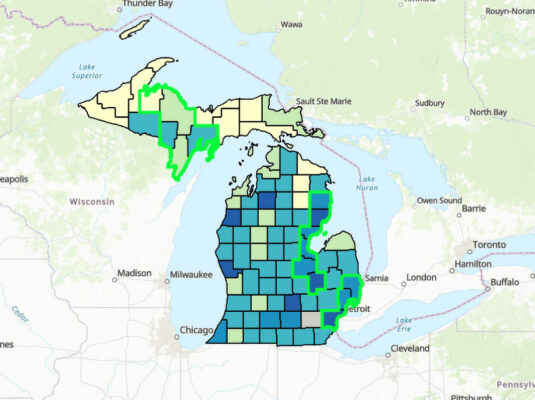
The landscape map and white paper linked below are a product of a partnership between the Opioid Prescription Engagement Network (OPEN) and Poverty Solutions at the University of Michigan. Using publicly available data from disparate sources (see the data link below for more details), the map considers indicators of mental and physical health, poverty, and opioid use throughout the state of Michigan in 2019. The white paper synthesizes the information in the map and highlights three clusters of counties experiencing particularly adverse effects from the crisis. For each cluster, considerations for mitigation or harm reduction efforts are provided.

Read more