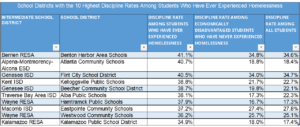
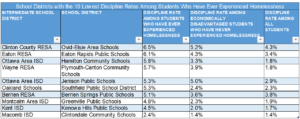
In order to facilitate a conversation around the role of school culture and local school district policies, this map explores the use of suspension and expulsion by school district. The map is color coded based on the discipline rates of students who have experienced homelessness. This choice was made because previous research shows students who have experienced homelessness to be at the greatest risk for exclusion from school due to suspension and expulsion. As you hover over each school district you will find the discipline rate for:
1. students who have ever experienced homelessness,
2. students who are economically disadvantaged who have never experienced homelessness, and
3. all students (the district-wide average).
*This research used data structured and maintained by the MERI-Michigan Education Data Center (MEDC). MEDC data are modified for analysis purposes using rules governed by MEDC and are not identical to those data collected and maintained by the Michigan Department of Education (MDE) and/or Michigan’s Center for Educational Performance and Information (CEPI). Results, information and opinions solely represent the analysis, information and opinions of the authors and are not endorsed by, or reflect the views or positions of, grantors, MDE and CEPI or any employee thereof.
If you would like to explore the data further for your local school district or intermediate school district, the data table the map is based on can be downloaded here.


