Alexandra Murphy
Assistant Research Scientist, Poverty Solutions, Ford School of Public Policy; Faculty Associate, Population Studies Center, Institute for Social Research; Associate Director of Social Science Research, MCity
murphyal@umich.eduReliable access to transportation is essential to holding a job, grocery shopping, and getting to school, child care, social services, and other activities. Transportation insecurity — the experience of being unable to move from place to place in a safe or timely manner — has important consequences for people’s ability to connect to opportunity and flourish.
University of Michigan researchers have developed the first validated measure of transportation security that offers insights into who experiences transportation insecurity and enables researchers and practitioners to determine both the causes and consequences of transportation insecurity as well as identify which interventions can improve this condition.

Modeled after the Food Security Index, the Transportation Security Index is a validated survey instrument composed of items that focus on the symptoms of transportation insecurity (for example, taking a long time to plan out everyday trips and rescheduling appointments). By focusing on symptoms of transportation insecurity, the measure spares researchers from attempting the impossible task of cataloging every possible input — from bus schedules to gas prices — that influences transportation insecurity.
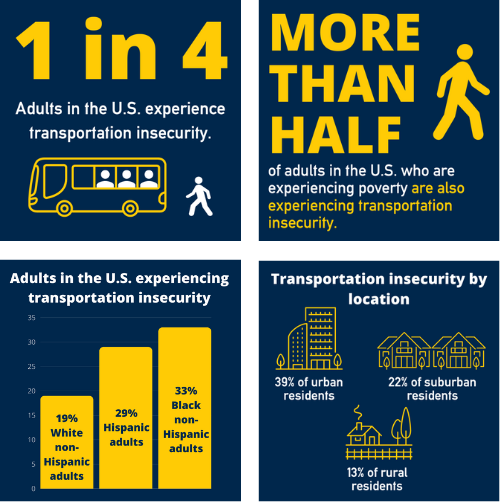
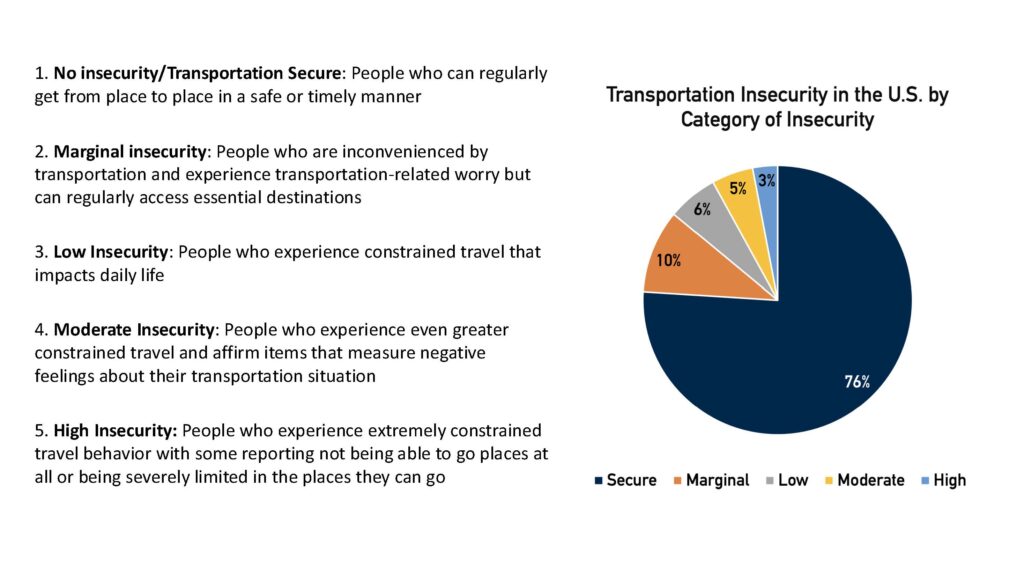
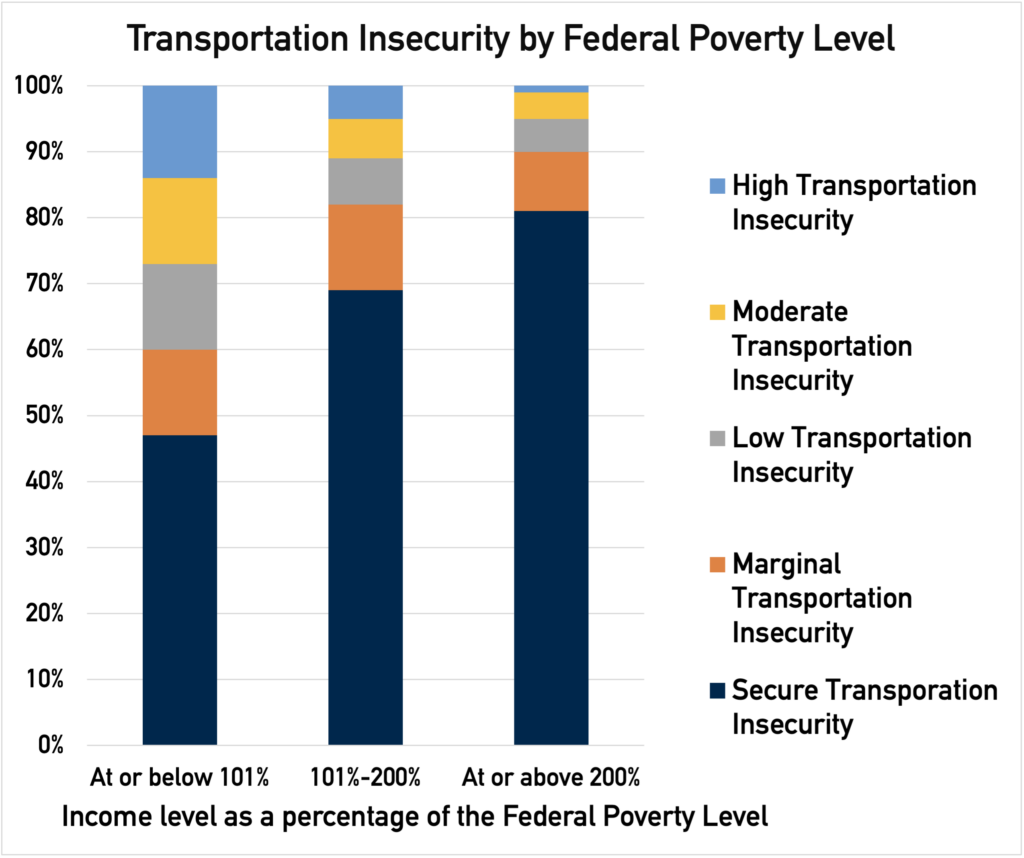
The Transportation Security Index is informed by extensive qualitative work — including ethnographic observations and 187 interviews — capturing the lived experiences of people experiencing transportation insecurity, and it has been validated using a nationally representative survey. The index can be used to assign respondents a continuous score representing their level of transportation insecurity or to categorize respondents as experiencing no insecurity or levels of insecurity that differ in severity. As the figures below show, such categories enable a deeper understanding of transportation insecurity.

Data from MacDonald-Lopez, Karina, Alexandra K. Murphy, Jamie Griffin, Michael Bader, Alix Gould-Werth, and Nicole Kovski. 2023. “A Driver in Health Outcomes: Developing Discrete Categories of Transportation Insecurity.” American Journal of Epidemiology.

Data from Transportation Insecurity in the United States: A Descriptive Portrait, Socius journal article, September 2022
The original Transportation Security Index (TSI-16) is composed of 16 items and identifies five categories of transportation insecurity. An abbreviated 6-item TSI (TSI-6) has been developed, validated, and been shown to perform equally as well as the original score; it identifies three categories of insecurity. Recently, an even more abbreviated TSI composed of 3 items (TSI-3) has been developed, validated, and been shown to perform as well as the TSI-6; it identifies two categories of insecurity. (Results are to be peer-reviewed soon and are available upon request.)
Both the 16-item and 6-item TSI are available under the CC-BY-NC-ND license. Please include the following attribution on all copies of the TSI: “Copyright (c) 2018 The Regents of the University of Michigan,” the citations below, and a link to the CC-BY-NC-ND license on all copies of the TSI. Any noncommercial use of unmodified TSI is permitted. If you are interested in commercial use or in building upon or modifying the TSI, please contact TransportationSecurityIndex@umich.edu.
Citations
Gould-Werth, Alix, Jamie Griffin, and Alexandra K. Murphy. 2018. “Defining a New Measure of Transportation Insecurity: An Exploratory Factor Analysis.” Survey Practice, 11:2, pp. 1-36.
Murphy, Alexandra K, Alix Gould-Werth, and Jamie Griffin. 2021. “Validating the Sixteen Item Transportation Security Index in a Nationally Representative Sample: A Confirmatory Factor Analysis” Survey Practice.
MacDonald-Lopez, Karina, Alexandra K. Murphy, Jamie Griffin, Michael Bader, Alix Gould-Werth, and Nicole Kovski. 2023. “A Driver in Health Outcomes: Developing Discrete Categories of Transportation Insecurity.” American Journal of Epidemiology.
Murphy, Alexandra K., Alix Gould-Werth, & Jamie Griffin. 2024. “Using a Split-Ballot Design to Validate an Abbreviated Categorical Measurement Scale: An Illustration Using the Transportation Security Index.” Survey Practice, 1-17.
The Transportation Security Index’s simple-to-administer questions allow policymakers, planners, practitioners, and researchers to use the index for a wide variety of purposes that help us better understand and address transportation insecurity. Examples of potential use cases include:
Several of our team members spent years interviewing and spending time with individuals with low incomes who faced significant transportation-related challenges. As we looked at available tools to capture the experiences of these individuals, we found many measures were proxies, falling short in capturing what we saw on the ground. For example, survey researchers sometimes look at whether people have cars to assess whether they can get around adequately. But we found there are many people who have cars who cannot get around when they cannot pay for gas, insurance, or repairs. Proximity to bus lines also cannot tell you much about transportation insecurity: our interviews revealed that some people live close to public transit but do not take it because they worry about their safety or have small children and find public transportation too cumbersome. Our qualitative research also revealed that social networks — friends, family, neighbors, co-workers — are a key way that people get around. No existing measures captured this important, relational dimension of mobility. Because many existing measures are based on travel behavior (e.g. commute time), they miss people who barely get around at all (“unmet demand”). Finally, many researchers, planners, and practitioners use different measurements and language to talk about and measure transportation insecurity. We thought providing a single, consistent measure and concept would provide a shared language for the community and enable better comparison of findings across populations and outcomes, thereby allowing us to better understand the causes and consequences of transportation insecurity. For all of these reasons, we determined a new, individual-level measure explcitly designed to capture transportation insecurity itself was warranted.
The Food Insecurity Index, developed by the U.S. Department of Agriculture, is a well-respected, rigorous tool used to assess food insecurity in the U.S. One of its great strengths is that it draws on qualitative research to directly capture the experience of food insecurity. That is, rather than asking questions about “inputs,” like calories consumed, it asks questions that revolve around the symptoms of food insecurity (i.e. “In the last 30 days, did you ever cut the size of your meals or skip meals because there wasn’t enough money for food?”). Given the many different modes of transportation people use, we thought a Transportation Security Index based on symptoms rather than inputs was ideal. Since existing measures missed the qualitative experiences of transportation insecurity we saw on the ground, we also thought it best to develop new, original questions designed to actually capture the phenomenon of transportation insecurity.
Because the Transportation Security Index was designed to capture transportation insecurity at the individual level, it is the only existing measurement best suited to do this. The index is “mode agnostic,” meaning it does not ask about people’s mode of travel specifically, so it is impervious to changes in the landscape of transportation and is thus well positioned to understand how the introduction of autonomous vehicles, for example, will impact transportation insecurity. The index is the only one of its kind to capture the relational dimensions of transportation insecurity. Finally, one of the most challenging issues for transportation researchers is capturing trips not taken (i.e. “unmet demand”). By creating questions tailored to people who face the most difficulties getting around, the Transportation Security Index is uniquely able to capture people unable to leave the house and skipping trips because of problems with transportation.
Anyone! The index was designed to be used by multiple parties, for different purposes, across different sectors from researchers to policymakers to planners to practitioners. The index can easily be included on surveys, whether nationally representative or regional, to understand broad patterns and to deepen our understanding of the condition of transportation insecurity itself. The index is easy to administer and can be used by individual healthcare providers or social service providers as screening tools to determine which clients and patients are experiencing transportation insecurity. It can also be used as an evaluation tool to assess whether a transportation intervention (like providing free bus passes) is having its intended impact.
If you are interested in how you might use the Transportation Security Index, contact us at TransportationSecurityIndex@umich.edu. We are happy to explore how you might put the index to work.
If you are using the TSI in your own work, please let us know! We would like to keep track of how the index is being used and also what people are learning in using it.
Unfortunately, no. The Transportation Security Index was developed using complex, rigorous statistical methods to determine how questions are being endorsed and how they relate to one another in ways that constitute an index that measures the construct of interest (i.e. transportation insecurity). Accordingly, while you may use a subset of questions that comprise the index in your own work, it is important to recognize that no subset of questions can be considered to constitute an index in ways that will allow for comparisons with the data generated by the index itself. Nor will a subset of questions that are different than those validated in the three versions of the TSI identify transportation insecurity itself.
We strongly advise against this. In terms of changing item wording, the construction of each item was informed by extensive qualitative research and refined using cognitive interviews. Through such interviews, we know that respondents understand the question as it is phrased well and that their responses are capturing the kind of data that is intended. Altering question wording could comprise respondent burden, comprehension, and judgement. Furthermore, the questions as they exist are those that have been validated; altering their wording may change the results in ways that make comparisons across findings difficult. The same is true of changing the ordering of questions. The ordering as they are presented is the ordering that has been validated. Changing the ordering (or adding additional questions in between those items that comprise the index) may change the results in ways that compromise the quality of the data and the ability to make comparisons across findings.
If your goal is to measure transportation insecurity, all questions in the index must be used (see the previous question for more information). That being said, our team wishes to emphasize the importance of the relational questions in the index. Our extensive qualitative research uncovered that the relational symptoms of transportation insecurity were a key way transportation insecurity manifested in the everyday lives of people and could be just as troubling for people as the material symptoms. Our quantitative analysis has confirmed this. Transportation insecurity is a unidimensional condition experienced both materially and relationally.
Transportation insecurity, of course, has important implications for employment and health, among other things. However, in designing the Transportation Security Index, we were intentional in not including such destinations or outcomes of interest in the TSI questions. We did this so researchers can use the Transportation Security Index in a causal inference framework to look at the consequences of transportation insecurity on outcomes like employment, health, education, etc.
In the earliest stages of developing the TSI, each of our potential items did in fact include a reference to the costs of transportation. For example, the question about skipping going places was originally phrased as, “In the past 30 days, how often have you skipped going someplace because you could not afford transportation?” However, after we conducted cognitive interviews to see how respondents were interpreting our questions we realized that, for respondents, they did not interpret their experiences with symptoms of transportation insecurity as being tied to the costs of transportation. Instead, they reported skipping trips because, for example, the bus never showed up, or the ride with a friend that they had arranged fell through, or their car needed work and was not drivable. In many of these cases, having more financial resources for transportation would have ameliorated these problems. If respondents could afford a working car of their own, or even had cash for a rideshare, they would not be counting on other, less reliable transportation options. While an outside analyst would reach this conclusion, our respondents did not think in this way: In their eyes, the problem was the unreliable bus, rather than not having money for a car or a rideshare. They thus responded “never” to questions asking if they had skipped trip because they could not afford the transportation they needed.
In light of this finding, we determine that asking respondents to connect the symptom (skipped trips) to a root cause (lack of money) was generating more false negatives than false positives. Indeed, in subsequent rounds of cognitive interviews we conducted on questions without the financial qualifiers, few respondents with adequate financial resources endorsed items indicating transportation insecurity, while respondents whose financial situations prevented them from getting where they needed to go endorsed the questions we expected them to. Thus, in the current version of our questions, we remove any mention of the costs of transportation as being the sole reason why a symptom was experienced. By doing so, cognitive interviews revealed that our revised items more accurately captured those people who were experiencing transportation insecurity.
Each version of the TSI performs similarly well in terms of their ability to identify respondents experiencing transportation insecurity and the prevalence estimates they generate. The biggest difference between the versions is how many categories of transportation insecurity they can identify. Whereas the TSI-16 can identify five categories of insecurity (secure, marginal insecurity, low insecurity, moderate insecurity, high insecurity) the TSI-6 can only identify three categories (secure, marginal/low insecurity, moderate/high insecurity) and the TSI-3 can identify two categories (secure vs. insecure). All versions, however, can be used as a continuous score.
This project has been supported by the National Science Foundation (NSF) (OIA09936884); Stanford University’s Center on Poverty and Inequality (through funding provided by grant number H79AE000101 from the U.S. Department of Health and Human Services); Michigan Department of Transportation; University of Michigan’s Poverty Solutions; U-M’s College of Literature, Arts, and Science; U-M’s Office of Research; U-M’s Department of Sociology; U-M’s Center for Public Policies in Diverse Societies; MCity; U-M’s Population Studies Center (through NICHD center grant P2CHD041028); and U-M’s Center for Connected and Automated Transportation. Any opinions, findings, and conclusions or recommendations expressed in this material are those of the author(s) and do not necessarily reflect the views or official policies of the NSF, NIH, or HHS.
Contact the research team at TransportationSecurityIndex@umich.edu.

Assistant Research Scientist, Poverty Solutions, Ford School of Public Policy; Faculty Associate, Population Studies Center, Institute for Social Research; Associate Director of Social Science Research, MCity
murphyal@umich.edu
PhD, Director of Family Economic Security Policy, Washington Center for Equitable Growth

PhD, Independent consultant, survey research

PhD, former Postdoctoral Fellow at U-M, now Postdoctoral Fellow at University of Wisconsin

former graduate student at U-M, now Research & Insights Manager at OpenResearch

Associate Professor of Public Policy, U-M